Below are the S&P and 15 minute and daily charts with the immediate important levels marked on them. Also, notice the trendline being formed which was earlier acting as resistance but is now acting as support.
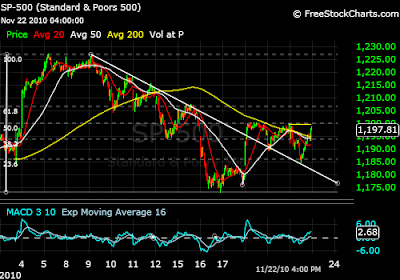

Resistance - 1198.75, 1200, 1207,1227
Support - 1173, 1183, 1193
Here is the link to today's Chart of the Day.
Take care and good luck!
2 comments:
i'm not liking the trends im seeing lately, it looks like false consolidation to me. i'm still moderately bullish on paper but my gut says the market mood has turned jittery and bearish. And with the markets moving so high the past 3 months it won't take much of a catalyst to bring it back to 10K, 1100, and 2300. Hopefully the holidays slow down any momentum the bears might have but positive data out of the US no longer has much effect on the markets at all lately, everyone is extremely focused on Europe and China. If Ireland turns into a political and social nightmare the Euro could unravel faster than you can say "yarn".
BTW a side note: Netflix raising rates and going full throttle streaming seems like a good idea. Until people actually do it. If everyone thats currently a customer went exclusively streaming, it would cut their profit margin in half. Again short it, 6 months. It will fall back to earth in the next 3 months but i say 6 just to be safe.
I know the term is rather overused but I feel this is a stock pickers market. As far as the overall markets are concerned, I wont be completely bullish until 1207 is crossed. What worries me at the moment is the overwhelming bullish sentiment about Thanksgiving week, that the market just can't go down this week. But again, as long as the support holds, it doesn't really matter if you are in the right stocks. I think the markets are gonna be choppy here, so its best to go with momentum stocks, not get too greedy, take profits quickly and losses even more quickly.
Post a Comment